

Ballistic Charts
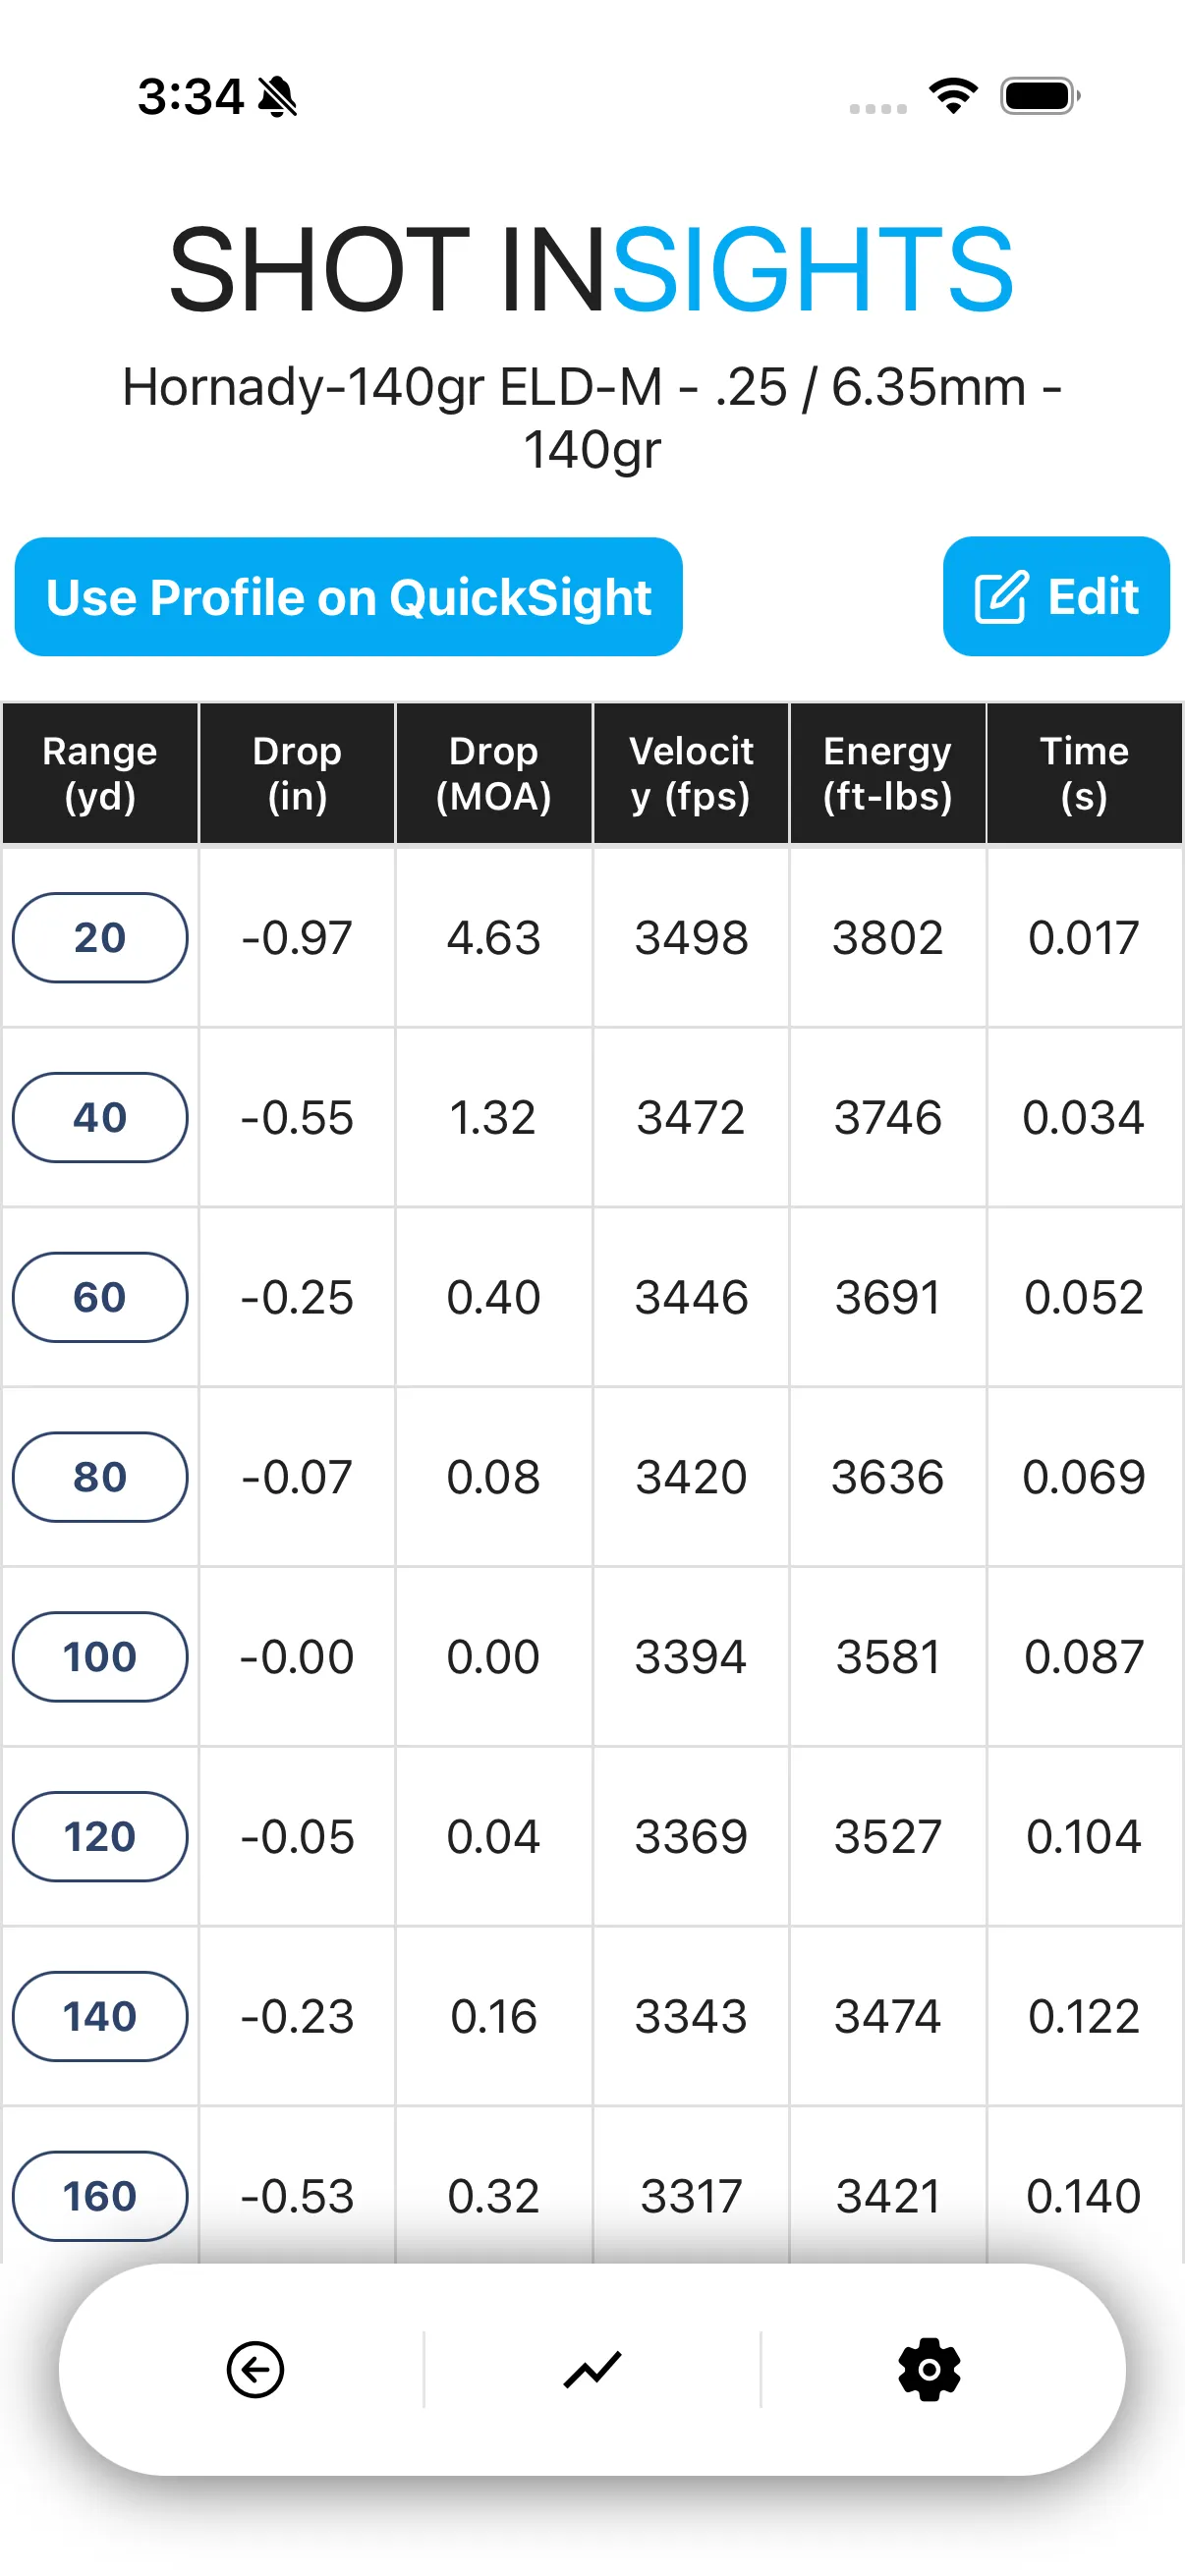
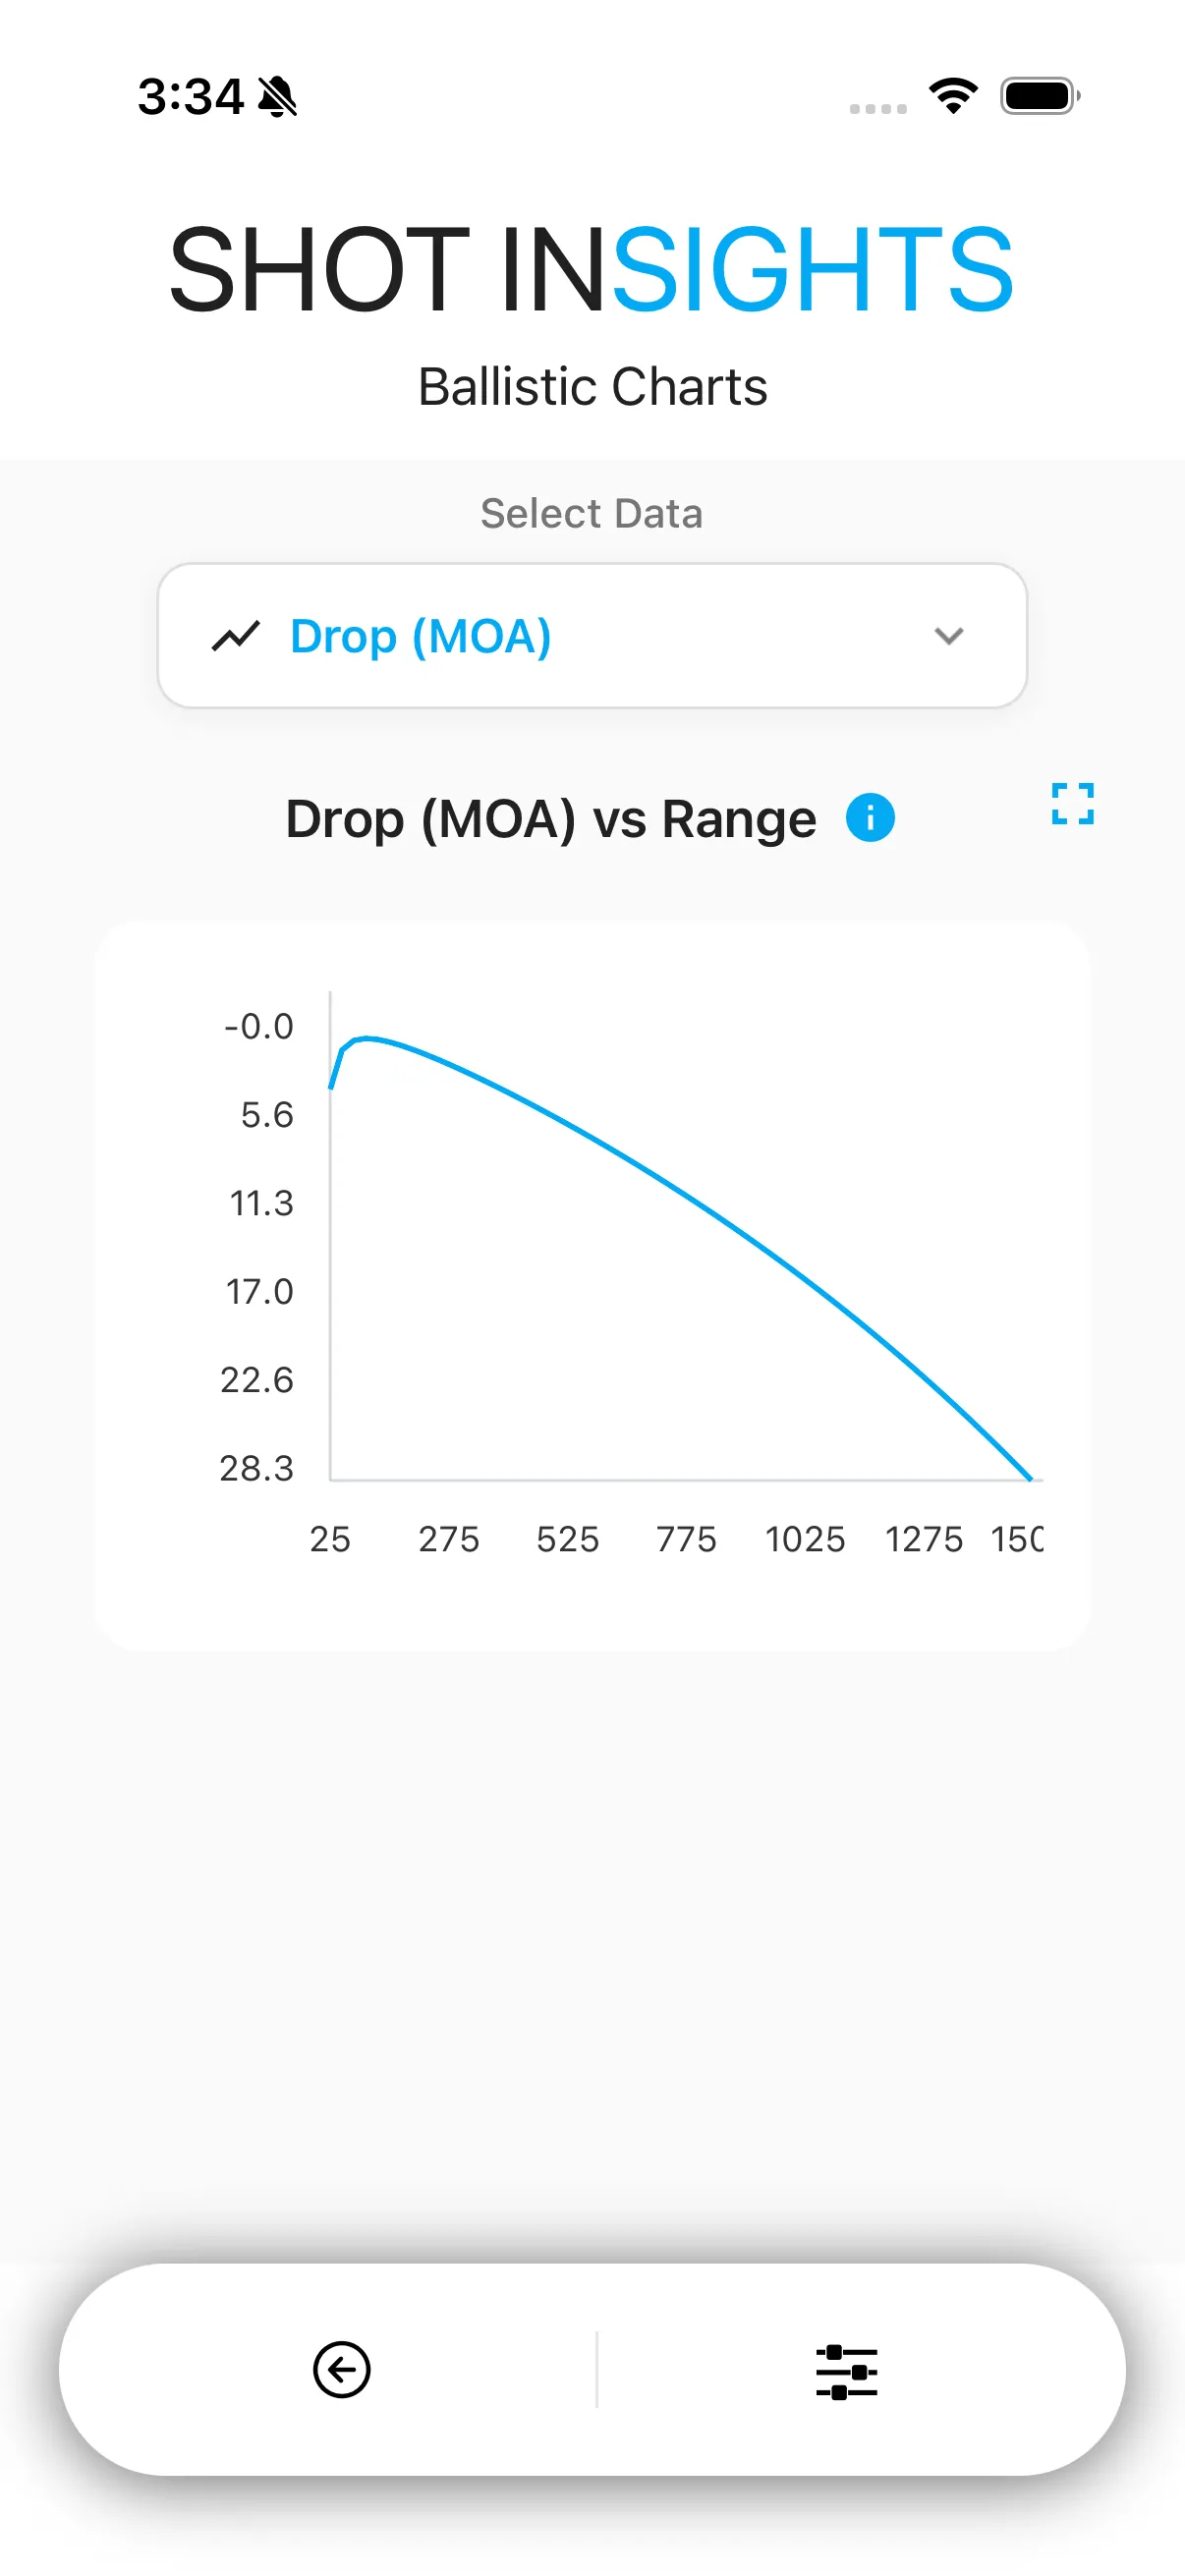
Ballistic charts turn a profile into an easy-to-scan view of how the bullet behaves at different distances. They are useful for confirming trends before you rely on the profile in the field.
What charts help you see
Section titled “What charts help you see”- How much drop increases with distance
- How wind holds grow as the shot gets longer
- How velocity and energy change downrange
- How long the bullet is in flight
Use a chart
Section titled “Use a chart”- Open the profile you want to review.
- Open the charts view.
- Scan the distances you care about most.
- Compare the chart values with your expected holds or past notes.
When charts are most useful
Section titled “When charts are most useful”- Before building a range card
- When checking how two loads compare
- After changing muzzle velocity, zero range, or environment inputs
- Treat the chart as a planning tool, then confirm it with real shooting.
- Refresh the environment before trusting long-range numbers.
- Use Compare Profiles when you want to see differences more directly.